

Updated March 2026
We've combined statistics from the past few months and our experience working with clients to give you a market update for the city and the suburbs.
HOME VALUES
PHILADELPHIA
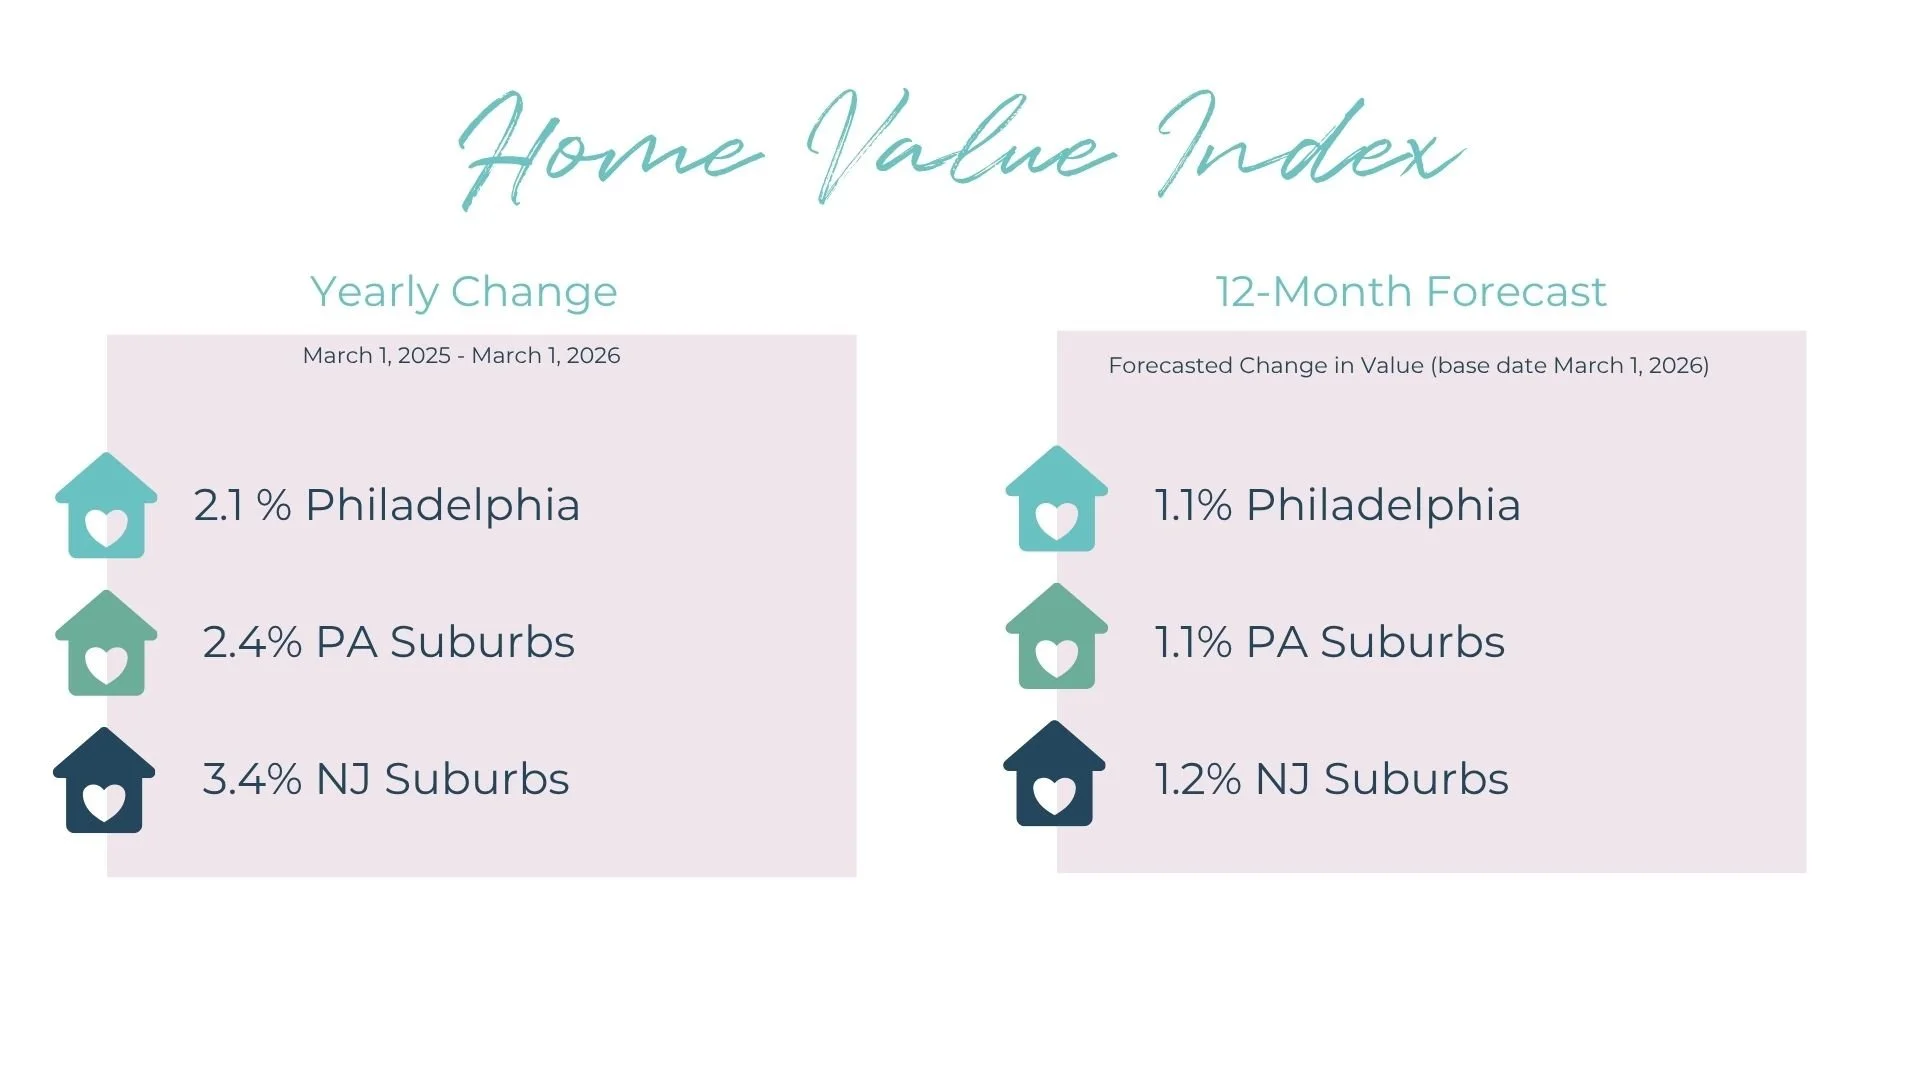
The home value index* at the end of February was $229,322, a 2.1% increase compared to this time last year.
While this is city-wide, the yearly changes by zip code range anywhere from -2.8% (in 19102) to +8% (in 19138). As always in Philly, submarkets are important when it comes to numbers.
SUBURBS
In all the surrounding PA counties, the change since last year increased: Bucks +3.3%, Chester +2.8% , Delaware +1.9%, Montgomery +1.5%, bringing the home value indexes to Bucks $504,215, Chester $556,352, Delaware $352,604, Montgomery $474,433.*
In all the surrounding NJ counties, the change since last year increased: Burlington +2.7%, Camden +4.8% , Gloucester +4.0%, Salem +1.6%, bringing the home value indexes to Burlington $408,977, Camden $343,291, Gloucester $369,720, Salem $284,101.*
Nearly all zip codes in the suburban counties continued to show positive yearly changes in value.


SUPPLY AND DEMAND
When the home supply exceeds the buyer demand, it’s considered a buyer’s market. When this happens, sellers have high competition and the leverage of the market leans toward buyers. You see more buyer concessions, like seller’s assists and home sale contingencies. On the flip side, a supply of homes that cannot meet the buyer demand is considered a seller’s market. Under these market conditions, buyers are in competition and the leverage leans toward the seller’s. This is what we have seen amplified in the past couple years, where it’s common to see low days on market, multiple bids, and waived inspections. Looking at the measurements for supply and demand helps predict how the market will react so you can be prepared to enter the market as a buyer or seller.
INVENTORY
Both Philadelphia and surrounding counties have had historically low supply of inventory in the past few years. This combined with high buyer demand created a high absorption rate where newly listed homes were purchased quickly, leaving all-time low inventory on the market. Last year, we started to see an increase in listing numbers across all areas, and got prepared for more…but it looks like increasing inventory has slowed. The number of new listings in the past 12 months in Philadelphia compared to the same time period the previous year had no change (-.05%)**. If you are a buyer right now in the city, you may feel like that number does not match your experience, and you may be correct. When you break down the new listing inventory by zip code, they vary. For example, in 19119 (Mount Airy), the year over year difference in new listings was -16% while it was +9% in 19134 (Port Richmond/Harrowgate)**.
Almost all suburbs, however, welcomed a much-needed increase in listening over the last 12 months compared to the previous 12 months: Bucks County +5%, Chester County +4%, Delaware County -1%, Montgomery County +3%, NJ Counties +4%.**
So what does this increase or decrease in listed homes mean? What kind of market is it? The MSI can help us determine the answer.
MONTHS SUPPLY OF INVENTORY
A number that helps quantify demand vs supply is the month's supply of inventory (MSI.) It combines the inventory and number of listings. The MSI represents how many months it would take to sell all the homes on the market based on its current sales pace (the demand). An MSI of under 5 usually reflects a seller’s market, 5-7 a balanced market, and > 7 a buyer’s market.
Philadelphia: The MSI was 6.2 at the end of March.**
This is slightly higher than where it has been for most of the year, between 3-5. Of course, when you look at submarkets in Philadelphia, there are differences when you compare zip codes. The MSI at the end of March in zip code 19107 was 16.1, indicative of a buyer’s market. In 19147, the MSI was 3.7 which leans more towards a seller’s market.
PA Suburbs: The MSI was 2.8 at the end of March.**
NJ Suburbs: The MSI was 3.5 at the end of March.**
This means it would take less than three months to sell all the inventory in the PA Philly suburbs based on the current demand, and three and a half months to sell all the inventory in the NJ Philly suburbs.
In those areas with higher MSI numbers, it’s more likely that seller’s assists and home sale contingencies are accepted in contracts. In areas with lower MSI numbers, it’s more likely to encounter a bidding war.


RATES AND AFFORDABILITY
It’s true that rates and inflation are factors in buyer affordability and demand. A 1% difference in a 30-yr mortgage translates to a $75 difference per month for every 100K you borrow. With the low inventory, we know some buyers have been in the market for a while now.
Since last fall, the rate on a 30-yr fixed mortgage has remained less than 6.5%, even dipping closer to 6%. This number can vary based on your debt to income ratio, your down payment, and credit. So while you may read about 6.3% rates, the range may start at somewhere close to 6%.
And remember, rates are not everything when it comes to affordability. There are ways to offset extra costs, like buying down points, seller’s assists, or using loan programs that offer grants. There are also Adjustable Rate Mortgages (ARMs) that have lower rates than conventional mortgages at the beginning of your loan.Talking one-on-one with an agent about affordability is an excellent way to remove tunnel vision when considering rates. They will be able to give you a target purchase price based on your monthly budget, or vice versa. They can also pair you with a lender that is the best fit for you.
Keep in mind that lowering rates increases the buyer demand. When the 30-yr fixed mortgage rate decreased from 6.6% in the first week of August 2025 to 6.3% in the first week of October 2025, the number of applications for a 30-yr fixed mortgage increased by 54%. (Data from Mortgage News Daily)
FORECAST FOR HOME VALUE
forecasts for the next 12 months. By county: +1.1% in Philadelphia, +1.2% in Delaware, +1.1% in Montgomery, +1.1% in Bucks, +1.1% in Chester, +1.1 in Burlington, +1.3 in Camden, 1.2% in Gloucester, 1.1% in Salem* (Zillow Home Value Forecast). As with the forecasts in the fall, the uniformity of these predictions is a sign that the market will not be jumping up or down. This is good for both buyers or sellers that have been trying to catch the “best time” to buy or list.


For buyers, submarkets are the name of the game in the Philly metro. Your competition and affordability may vary depending on where and what you are looking for in a home. Certain areas and price ranges in Philadelphia and the suburbs are still showing high competition, so you may encounter listings with multiple bids. In the city, many submarkets are showing numbers that represent a more balanced or buyer-leaning market, and some homes have been staying on the market longer. These are areas where you’ll have more leverage as a buyer. There is a better chance you’ll be able to buy with a home sale contingency, negotiate repairs, or get a seller’s assist. Even with a small bump in inventory, the suburbs are still showing leverage in the hands of sellers. If you are thinking about moving from the city to the suburbs, make sure you know the market you are selling in and the one you are entering as a buyer because they may be different.. Your agent can show you the data and prepare you so you’re ready when your perfect home hits the market.
Inventory has been the subject of almost every market update since we started these in 2018, and this one is no different. For sellers, inventory is still considered low. In the suburbs, the market still favors sellers, however, buyers are not reacting the same way they did two years ago in a similar market. For example, the average days on market across all surrounding counties increased 8% compared to the year before. In the city, new listings are being absorbed at a steady (not rapid) pace, reflecting a more balanced market. In some areas, buyers have more leverage than sellers right now. Listing your home with market pricing and perfect presentation gives you the best advantage to sell in this market. When you sit with us for a listing appointment, we pull data specific to your zip code or neighborhood, which may be different from the city-wide or suburb-wide data. This hyper-local report can better predict your home’s competition. We can help you put together a pricing strategy based on statistics and your motivation.


Philly Home Girls agents want to empower you with all the knowledge you need to make a decision about your real estate goals. We are ready to be your in-market leader, expert negotiator, fiduciary advocate, and overall guide through this process. If you are curious about the home buying or selling process or want to learn more about the current market, we’d love to set up a chat to answer all your questions.
*Data from Zillow.com | ** Data from BrightMLS | ^ Lindy Institute for Urban Innovation at Drexel University| 1 Data from Mortgage News Daily


If you've ever wondered about the differences between community ownership structures, you're not alone. The terms HOA, condo association, PUD, and co-op are often used interchangeably to describe any home that comes with a monthly fee, but there are real and important differences.